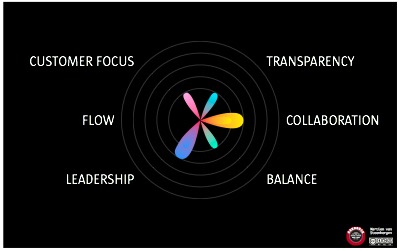
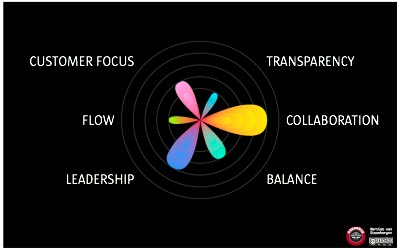
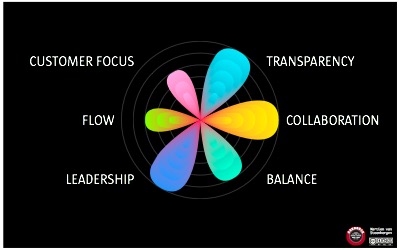
Somehow, I always have disliked radar charts. They connect unassociated dots and I find them antique remnants from the past millennium. They yearn for a fresh new look. Pondering and visualizing, I came up with the “flower chart”. The unfolding of the flower shows its gradual development, adds the time laps or ‘Zeitgeist’ to it.
The examples below use the six values of Mike Burrows’ Agendashift, value-based delivery, change, and leadership, based on Agile, Lean, and Kanban.


Thoughts?

I love your idea to evolve the radar diagram and the blooming flower is a great metaphor for team growth! Nice work.